In measures of dispersion, the standard deviation is one of the prominent tools to calculate the dispersion of the data
Standard Deviation
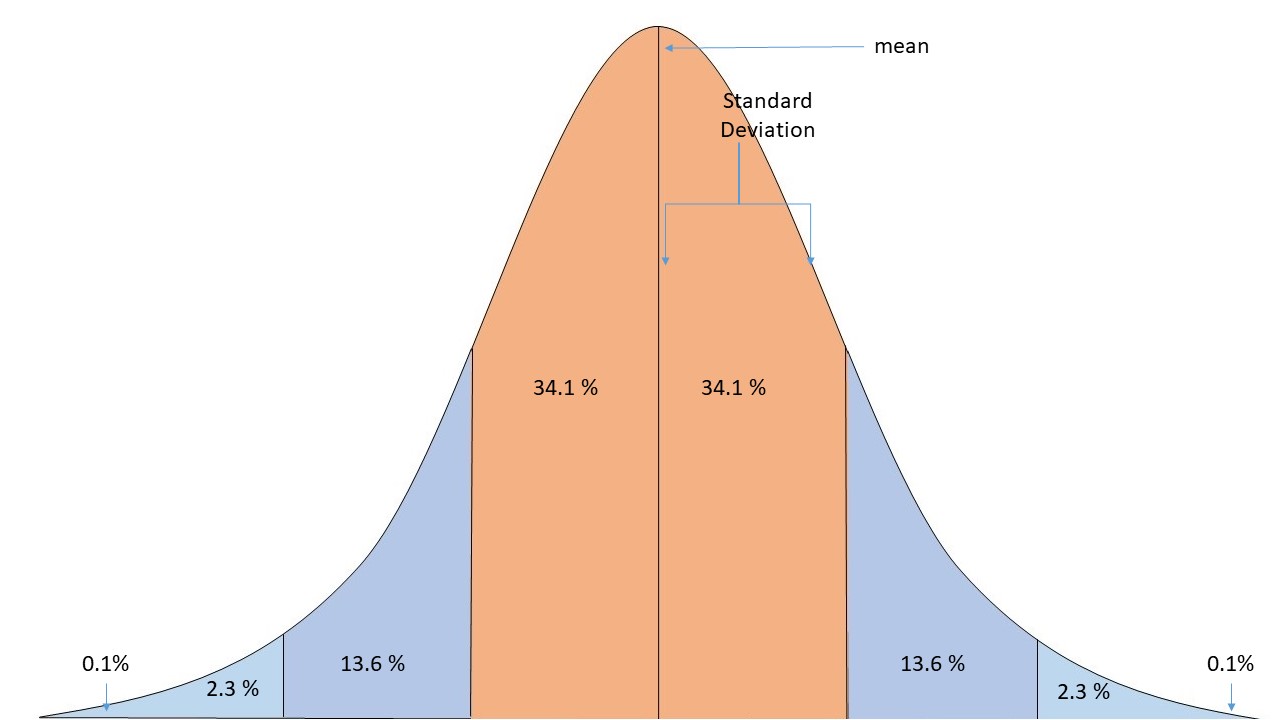
In measures of dispersion, the standard deviation is one of the prominent tools to calculate the dispersion of the data. The purpose of standard deviation is to calculate the deviation of data from the mean of the data. We first calculate the mean of the data, then we sum up the squared difference of each point from the mean.
Simple Data
Let’s directly start with an example of a simple series
34 34 40 43 45 46 48 46
The formula for a standard deviation for Simple Series is as follows, σ is Standard Deviation.
Standard Deviation Formula

In this equation,
N is the number of items in a series, d2 is the Squared differences of items from the series mean
| x | d=| x – μ | | d2 |
|---|---|---|
| 34 | 8.5 | 72.25 |
| 38 | 4.5 | 20.25 |
| 40 | 2.5 | 6.25 |
| 43 | 0.5 | 0.25 |
| 45 | 2.5 | 6.25 |
| 46 | 3.5 | 12.25 |
| 48 | 5.5 | 30.25 |
| 46 | 3.5 | 12.25 |
| Σx=340 , μ = 42.5 | Σd2= 160 |

From the above example, we get an idea of how the standard deviation works in theory and practice. As this is a simple series of data, we directly calculated the difference and deviations.
Although, we also face datasets of multiple types, like continuous and discrete series.
Discrete Data
The series below is a discrete series. This type of data can be explained with x as the value or price and f as the frequency of x’s occurrence.
Let’s say x is the value of an item ordered from a grocery store, and f will be how many units of item x are ordered.
The apples cost $60, and there are 250 apples. So the fx will be, 15000
| χ | ƒ |
| 60 | 250 |
| 62 | 300 |
| 64 | 410 |
| 66 | 500 |
| 67 | 350 |
| 68 | 275 |
| 69 | 150 |
| 70 | 100 |
| 71 | 25 |
| f=2360 |

The calculations in this table for standard derivation are slightly different from the simple series. But the root of the formula is still the same.
| χ | ƒ | ƒχ | d=| χ – μ | | d2 | ƒd2 |
|---|---|---|---|---|---|
| 60 | 250 | 15000 | 5.3 | 28.09 | 7022.5 |
| 62 | 300 | 18600 | 3.3 | 10.89 | 3267 |
| 64 | 410 | 26240 | 1.3 | 1.69 | 692.9 |
| 66 | 500 | 33000 | 0.7 | 0.49 | 245 |
| 67 | 350 | 23450 | 1.7 | 2.89 | 1011.5 |
| 68 | 275 | 18700 | 2.7 | 7.29 | 2004.75 |
| 69 | 150 | 10350 | 3.7 | 13.69 | 2053.5 |
| 70 | 100 | 7000 | 4.7 | 22.09 | 2209 |
| 71 | 25 | 1775 | 5.7 | 32.49 | 812.25 |
| Σƒ=2360 | Σƒχ=154115 | Σƒd2=19318.4 |

Continuous Data
Let’s learn to calculate standard deviation from continuous data. In the following example, we will take a sample of continuous data and apply the standard deviation formula on it.
An example of continuous data can be stocks of a company throughout each month of a year, or the average/cumulative weight of students in a class.
The following example of Classes of IQs and f is the number of students in those classes of IQs
| Class | F |
|---|---|
| 40-50 | 11 |
| 50-60 | 23 |
| 60-70 | 40 |
| 70-80 | 60 |
| 80-90 | 35 |
| 90-100 | 16 |
| 100-110 | 09 |
| 110-120 | 06 |
The formulae for standard deviation are

The First Equation calculates the mean of the series.
The second equation calculates the difference between series and mean.
The third equation calculates standard deviation.
| Class | Frequency f | Mid-value m | fm | d=|m-μ | μ=74.95 | d2 | fd2 |
|---|---|---|---|---|---|---|
| 40-50 | 11 | 45 | 495 | 29.95 | 897 | 9867 |
| 50-60 | 23 | 55 | 1265 | 19.95 | 398 | 9154 |
| 60-70 | 40 | 65 | 2600 | 9.95 | 99 | 3960 |
| 70-80 | 60 | 75 | 4500 | 0.05 | 0.0025 | 0.15 |
| 80-90 | 35 | 85 | 2975 | 10.05 | 101 | 3515 |
| 90-100 | 16 | 95 | 1520 | 20.05 | 402 | 6432 |
| 100-110 | 09 | 105 | 945 | 30.05 | 903 | 8127 |
| 110-120 | 06 | 115 | 690 | 40.05 | 1604 | 9624 |
| Σƒ=200 | Σƒm=14990 | Σƒd2=50699.15 |


From the above calculation we get that average IQ of all students is 74.95, and we get the standard deviation from IQ
If you are still wondering, what will we get from calculating? We can find the spread of the data by comparing the difference between the mean and standard deviation.
Let’s see how the widespread and densely populated data would look.


ANCOVA: Analysis of Covariance with python
ANCOVA is an extension of ANOVA (Analysis of Variance) that combines blocks of regression analysis and ANOVA. Which makes it Analysis of Covariance.
Learn Python The Fun Way
What if we learn topics in a desirable way!! What if we learn to write Python codes from gamers data !!
Meet the most efficient and intelligent AI assistant : NotebookLM
Start using NotebookLM today and embark on a smarter, more efficient learning journey!
Break the ice
This can be a super guide for you to start and excel in your data science career.
IQR with Excel and python
In this article, we will learn how to utilize the functionalities provided by excel and python libraries to calculate IQR,
Tourism Trend Prediction
After tourism was established as a motivator of local economies (country, state), many governments stepped up to the plate.
Sentiment Analysis Polarity Detection using pos tag
Sentiment analysis can determine the polarity of sentiments from given sentences. We can classify them into certain categories.
For loop with Dictionary
Traverse a dictionary with for loop Accessing keys and values in dictionary. Use Dict.values() and Dict.keys() to generate keys and values as iterable. Nested Dictionaries with for loop Access Nested values of Nested Dictionaries How useful was this post? Click on a star to rate it! Submit Rating
For Loops with python
For loop is one of the most useful methods to reuse a code for repetitive execution.
Metrics and terminologies of digital analytics
These all metrics are revolving around visits and hits which we are getting on websites. Single page visits, Bounce, Cart Additions, Bounce Rate, Exit rate,
Hypothesis Testing
Hypothesis testing is a statistical method for determining whether or not a given hypothesis is true. A hypothesis can be any assumption based on data.
A/B testing
A/B tests are randomly controlled experiments. In A/B testing, you get user response on various versions of the product, and users are split within multiple versions of the product to figure out the “winner” of the version.
For Loop With Tuples
This article covers ‘for’ loops and how they are used with tuples. Even if the tuples are immutable, the accessibility of the tuples is similar to that of the list.
Multivariate ANOVA (MANOVA) with python
MANOVA is an update of ANOVA, where we use a minimum of two dependent variables.
Points You Earned

0 distinction_points

python_points 0
0 Solver points
Leave a Reply
You must be logged in to post a comment.