Let’s learn to calculate the spread of the data and measure it. with Absolute measures and Relative measures
Methods Of Dispersion
In statistics while handling data there is a need to tell how the data is formed or how it is spread.
So there comes an array of methods which are utilized to find the way data is spread and measure it.
Yes, this topic is from class 11 maths class. It is also overlooked by many, so this assortment of articles will come as a refresher.
We also plan to inform on how to use these techniques in data science.
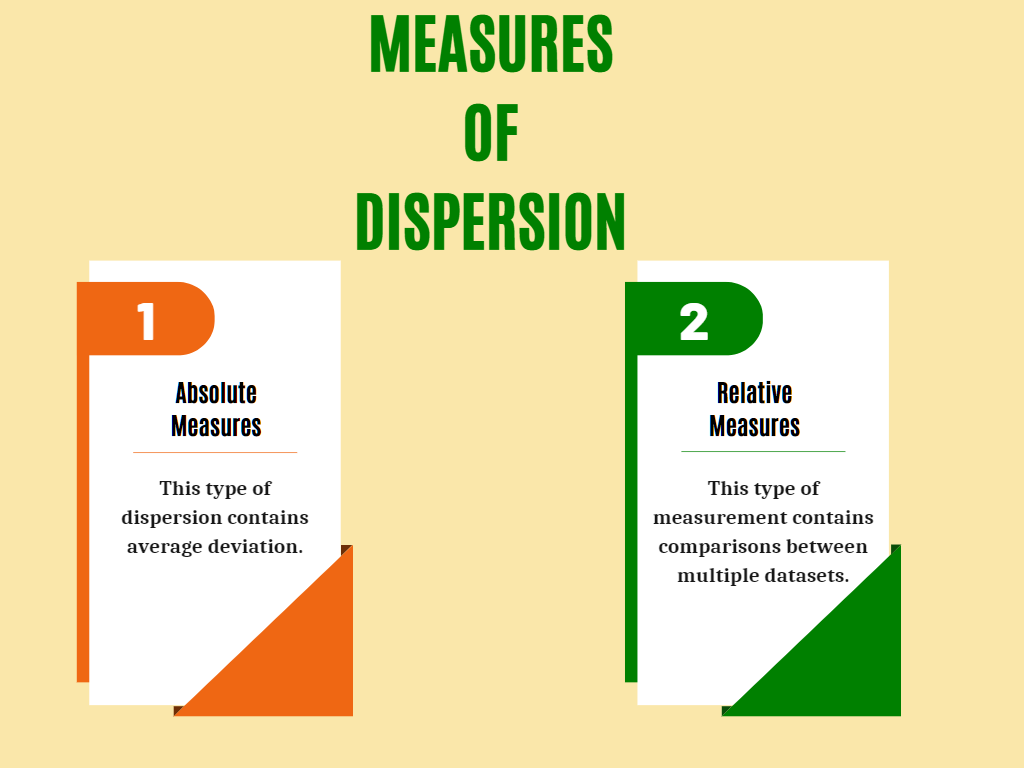
Absolute Measures
Absolute measures of dispersions calculate the variance between averages of deviations.
These measures explain the data with standard deviation and mean deviation.

Relative Measure
Relative measures of dispersion are used to compare multiple datasets. Relative measures utilize the coefficients of ranges.
Relative measures utilize the coefficient of all the units from absolute measures like coefficient of quartile deviation and coefficient of variation and so on.

We plan to introduce most of the useful methods needed in data science.
methodsofdispersion
ANCOVA: Analysis of Covariance with python
ANCOVA is an extension of ANOVA (Analysis of Variance) that combines blocks of regression analysis and ANOVA. Which makes it Analysis of Covariance.
Learn Python The Fun Way
What if we learn topics in a desirable way!! What if we learn to write Python codes from gamers data !!
Meet the most efficient and intelligent AI assistant : NotebookLM
Start using NotebookLM today and embark on a smarter, more efficient learning journey!
Break the ice
This can be a super guide for you to start and excel in your data science career.
SQL Exercise : Basics
Improve your analytical skills by practicing the following tasks
SQL quiz : HAVING
Solve the task by completing the SQL script
Quiz on LAG function
Learn about LAG function in SQL and solve the quiz.
Quiz on Python Function basics
fill in the blanks to complete the code.
Quiz on pandas basics
Brush up on your pandas basics knowledge. Drag and drop quizzes.
Numpy Excercise
Improve your analytical skills by practicing the following tasks
Random Forest with python
Random forest trees combine multiple decision trees to obtain an output. And it is flexible enough to adapt to Classification and Regression.
Standard Deviation
In measures of dispersion, the standard deviation is one of the prominent tools to calculate the dispersion of the data
Methods Of Dispersion
Let’s learn to calculate the spread of the data and measure it. with Absolute measures and Relative measures
Interquartile Range
Interquartile range is the difference between first and last quarters in a series of numbers. A Quartile range means a four-partition series of numbers.
Points You Earned

0 distinction_points

python_points 0
0 Solver points
Leave a Reply
You must be logged in to post a comment.